Earth Science
Geologic Time
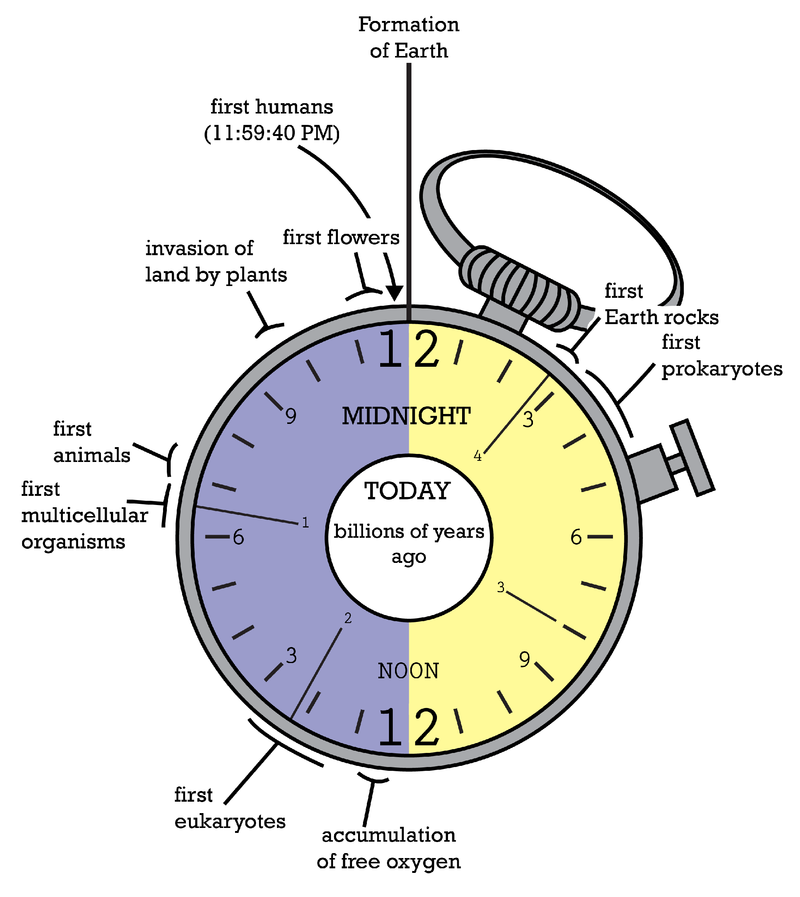
Earth was formed about 4.65 billion years ago. Scientists use the geologic time scale to describe events that have happened throughout Earth’s history.
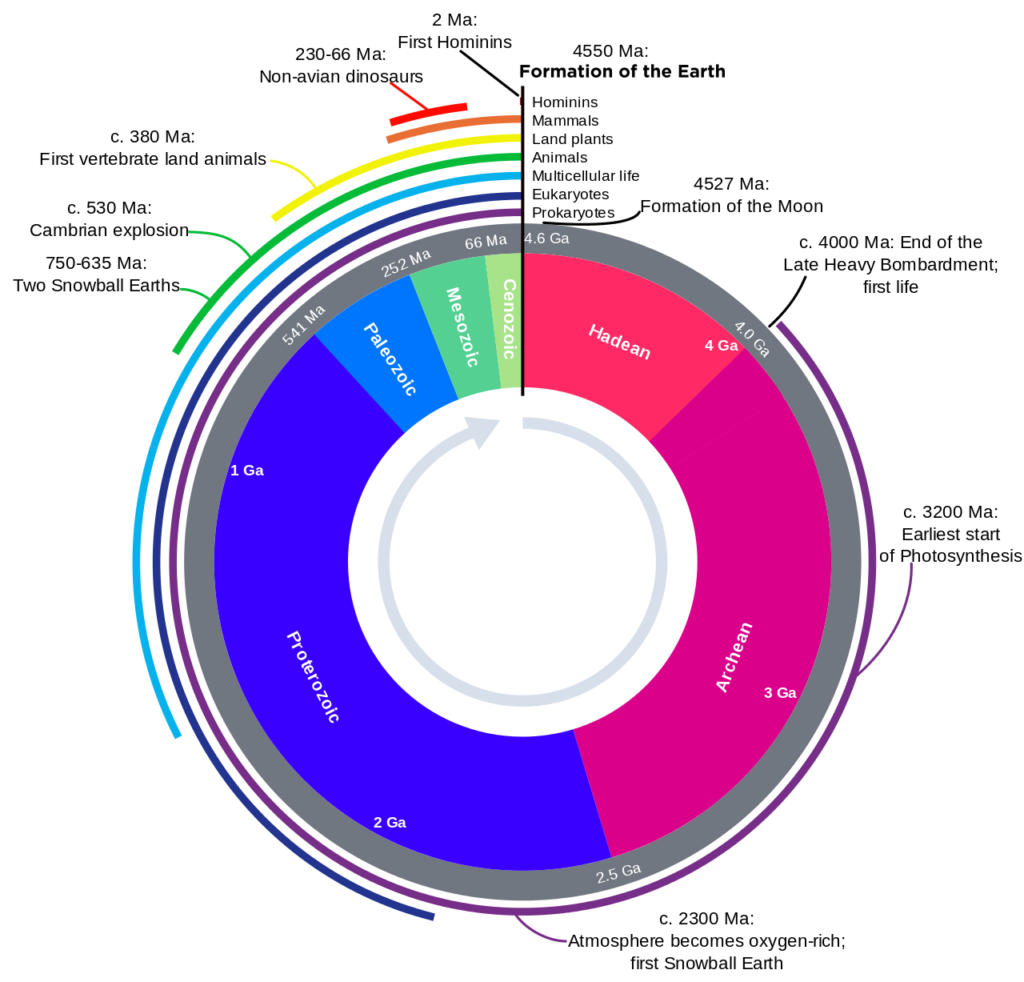
If the entirety of Earth’s history was represented on a clock, humans would appear at 11:59:40 PM.
Origins of Life on Earth: Bacteria, Plants, and Animals
- 4.65 billion years ago: Earth is formed
- 4 billion years ago: The first life on Earth was simple, prokaryotic bacteria.
- 600 million years ago: Aquatic plants and animals evolved. It is likely that life originated in water because it offered early organisms more temperature stability compared to land, currents provided early movement, and they didn’t have to fight gravity.
- 500 million years ago: Huge period of evolution and diversification of life known as the Cambrian Period.
- 400 million years ago: Terrestrial plants and animals evolved.
- 65-250 million years ago: Dinosaurs lived during the Mesozoic Era.
- 200,00-300,000 years ago: Homo sapiens, early ancestors of humans, evolved.
Snowball Earth
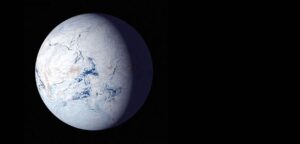
At least three times in Earth’s history, the planet was engulfed almost entirely in ice–an event called Snowball Earth. These events happened between 580 and 750 million years ago. Evidence for Snowball Earth comes from sedimentary rocks. In a normal ice age, the types of rock deposited by glaciers would be found mostly near Earth’s poles. However, geologists found glacial rocks of similar ages around the world, at both the poles and equatorial regions. This led to the Snowball Earth theory.
Snowball Earth was caused by a chain of events called a positive feedback loop. Ice has a high albedo and is very insulating, so it is not heated up efficiently by sunlight. As ice accumulated on the planet, it increasingly reflected more sunlight and cooled Earth even further. Thus, this created a cycle of ice formation, increased albedo, and cooling of Earth which continued until the entire planet was covered in ice.
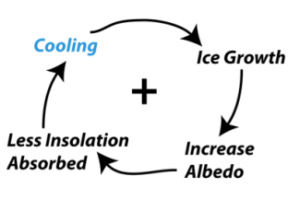
Why is Earth not covered in ice now if the positive feedback loop continues forever? The leading theory is that volcanoes continued erupting during Snowball Earth, emitting high levels of carbon dioxide, which was trapped under the ice. Eventually, the carbon dioxide built up enough to start melting the ice. Ice turned to water, which has a lower albedo and thus absorbed more of the Sun’s energy. This led to a new positive feedback loop that resulted in warming of the planet and the end of Snowball Earth. Additionally, it is believed that bacterial life on Earth survived the harsh conditions during Snowball Earth events by living near the heat sources from volcanoes.

K-6 Standards
2-ESS2-3. Obtain information to identify where water is found on Earth and that it can be solid
or liquid.
Pangaea
Due to plate tectonics, Earth’s land is constantly shifting and changing over time. 250 million years ago, all of Earth’s landmass was united in a single supercontinent called Pangaea. About 200 million years ago, this supercontinent began to break up into pieces as the plates moved away from each other. Smaller landmasses were formed until, eventually, the continents we recognize today were shaped. It is easy to see how certain continents, like South America and Africa, once fit together. Even today, the location of the continents continues to fluctuate. Scientists theorize that a new supercontinent, called Pangaea Proxima, could form 250 million years in the future.
Continental Drift
Proposed by scientist Alfred Wegener, the theory of continental drift was one of the earliest ways to explain why continents moved over time. Wegener noticed that the shape of Earth’s continents, such as South America and Africa, could fit together like a jigsaw puzzle. He also studied fossils from different continents that showed the remains of identical plants and animals spread throughout the world. For example, dinosaurs lived during the Triassic, Jurassic, and Cretaceous periods. As Pangaea broke into different pieces, fossils show that dinosaurs spread to different continents and evolved into different species over time. Based on this evidence, Wegener theorized that all of Earth’s continents were originally united in the supercontinent Pangaea. Over time, they drifted apart to their current positions.

While parts of this theory were correct, Wegener’s ideas had some flaws. For example, Wegener was unable to explain how the continents had separated over time. Consequently, this theory was replaced by the plate tectonics theory which is discussed in the next chapter, “Earth’s Structure: At the Surface and Underground”.
Key Takeaways
Timeline of Earth’s History:

NGSS
Performance Expectations
| 2-ESS1-1. | Constructing Explanations and Designing SolutionsConstructing explanations and designing solutions in K–2 builds on prior experiences and progresses to the use of evidence and ideas in constructing evidence-based accounts of natural phenomena and designing solutions. Make observations from several sources to construct an evidence-based account for natural phenomena.“>Use information from several sources to provide evidence that ESS1.C: The History of Planet EarthSome events happen very quickly; others occur very slowly, over a time period much longer than one can observe.“>Earth events Stability and ChangeThings may change slowly or rapidly.“>can occur quickly or slowly. [Clarification Statement: Examples of events and timescales could include volcanic explosions and earthquakes, which happen quickly and erosion of rocks, which occurs slowly.] [Assessment Boundary: Assessment does not include quantitative measurements of timescales.] |
|---|
| 2-ESS2-2. | Developing and Using ModelsModeling in K–2 builds on prior experiences and progresses to include using and developing models (i.e., diagram, drawing, physical replica,
diorama, dramatization, or storyboard) that represent concrete events or design solutions.Develop a model to represent patterns in the natural world.“>Develop a model to represent ESS2.B: Plate Tectonics and Large-Scale System InteractionsMaps show where things are located. One can map the shapes and kinds ofland and water in any area.“>the shapes and kinds of land and bodies of water PatternsPatterns in the natural world can be observed.“>in an area. [Assessment Boundary: Assessment does not include quantitative scaling in models.] |
|---|
| 2-ESS2-3. | Obtaining, Evaluating, and Communicating InformationObtaining, evaluating, and communicating information in K–2 builds on prior experiences and uses observations
and texts to communicate new information.Obtain information using various texts, text features (e.g., headings, tables of contents, glossaries, electronic menus, icons), and other media that will be useful in answering a scientific question.“>Obtain information to identify PatternsPatterns in the natural world can be observed.“>where water is found on Earth ESS2.C: The Roles of Water in Earth’s Surface ProcessesWater is found in the ocean, rivers, lakes, and ponds. Water exists as solid ice andin liquid form.“>and that it can be solid or liquid. |
|---|
| 4-ESS2-2. | Analyze and Interpret DataAnalyzing data in 3–5 builds on K–2 experiences and progresses to introducing quantitative approaches to collecting
data and conducting multiple trials of qualitative observations. When possible and feasible, digital tools should be used.Analyze and interpret data to make sense of phenomena using logical reasoning. (4-ESS2-2).“>Analyze and interpret data ESS2.B: Plate Tectonics and Large-Scale System InteractionsThe locations of mountain ranges, deep oceantrenches, ocean floor structures, earthquakes, and volcanoes occur in patterns. Most earthquakes and volcanoes occur in bands that are often along the boundaries between continents and oceans. Major mountain chains form inside continents or near their edges. Maps can help locate the different land and water features areas of Earth.“>from maps to describe PatternsPatterns can be used as evidence to support an explanation.“>patterns of ESS2.B: Plate Tectonics and Large-Scale System InteractionsThe locations of mountain ranges, deep oceantrenches, ocean floor structures, earthquakes, and volcanoes occur in patterns. Most earthquakes and volcanoes occur in bands that are often along the boundaries between continents and oceans. Major mountain chains form inside continents or near their edges. Maps can help locate the different land and water features areas of Earth.“>Earth’s features. [Clarification Statement: Maps can include topographic maps of Earth’s land and ocean floor, as well as maps of the locations of mountains, continental boundaries, volcanoes, and earthquakes.] |
|---|
| 5-ESS2-1. | Developing and Using ModelsModeling in 3–5 builds on K–2 experiences and progresses to building and revising simple models and using models to represent events and design solutions.Develop a model using an example to describe a scientific principle.“>Develop a model using an example to describe ESS2.A: Earth Materials and SystemsEarth’s major systems are the geosphere (solid and molten rock, soil, and sediments), the hydrosphere (water and ice), the atmosphere (air), and the biosphere (living things, including humans). These systems interact in multiple ways to affect Earth’s surface materials and processes. The ocean supports a variety of ecosystems and organisms, shapes landforms, and influences climate. Winds and clouds in the atmosphere interact with the landforms to determine patterns of weather.”>ways the geosphere, biosphere, hydrosphere, and/or atmosphere Systems and System ModelsA system can be described in terms of its components and their interactions. “>interact. [Clarification Statement: Examples could include the influence of the ocean on ecosystems, landform shape, and climate; the influence of the atmosphere on landforms and ecosystems through weather and climate; and the influence of mountain ranges on winds and clouds in the atmosphere. The geosphere, hydrosphere, atmosphere, and biosphere are each a system.] [Assessment Boundary: Assessment is limited to the interactions of two systems at a time.] |
|---|
| 5-ESS2-2. | Using Mathematics and Computational ThinkingMathematical and computational thinking in 3–5 builds on K–2 experiences and progresses to extending quantitative measurements to a variety of physical properties and using computation and mathematics to analyze data and compare alternative design solutions.Describe and graph quantities such as area and volume to address scientific questions.“>Describe and graph Scale, Proportion, and QuantityStandard units are used to measure and describe physical quantities such as weight and volume.”>the amounts ESS2.C: The Roles of Water in Earth’s Surface ProcessesNearly all of Earth’s available water is in the ocean. Most fresh water is in glaciers or underground; only a tiny fraction is in streams, lakes, wetlands, and the atmosphere.“>of salt water and fresh water in various reservoirs Using Mathematics and Computational ThinkingMathematical and computational thinking in 3–5 builds on K–2 experiences and progresses to extending quantitative measurements to a variety of physical properties and using computation and mathematics to analyze data and compare alternative design solutions.Describe and graph quantities such as area and volume to address scientific questions.“>to provide evidence about ESS2.C: The Roles of Water in Earth’s Surface ProcessesNearly all of Earth’s available water is in the ocean. Most fresh water is in glaciers or underground; only a tiny fraction is in streams, lakes, wetlands, and the atmosphere.“>the distribution of water on Earth. [Assessment Boundary: Assessment is limited to oceans, lakes, rivers, glaciers, ground water, and polar ice caps, and does not include the atmosphere.] |
|---|
| MS-ESS2-2. | Constructing Explanations and Designing SolutionsConstructing explanations and designing solutions in 6–8 builds on K–5 experiences and progresses to include constructing explanations and designing solutions supported by multiple sources of evidence consistent with scientific ideas, principles, and theories.Construct a scientific explanation based on valid and reliable evidence obtained from sources (including the students’ own experiments) and the assumption that theories and laws that describe nature operate today as they did in the past and will continue to do so in the future.“>Construct an explanation based on evidence for how ESS2.A: Earth Materials and SystemsThe planet’s systems interact over scales that range from microscopic to global in size, and they operate over fractions of a second to billions of years. These interactions have shaped Earth’s history and will determine its future.ESS2.C: The Roles of Water in Earth’s Surface ProcessesWater’s movements—both on the land and underground—cause weathering and erosion, which change the land’s surface features and create underground formations.“>geoscience processes have changed Earth’s surface Scale, Proportion, and QuantityTime, space, and energy phenomena can be observed at various scales using models to study systems that are too large or too small.“>at varying time and spatial scales. [Clarification Statement: Emphasis is on how processes change Earth’s surface at time and spatial scales that can be large (such as slow plate motions or the uplift of large mountain ranges) or small (such as rapid landslides or microscopic geochemical reactions), and how many geoscience processes (such as earthquakes, volcanoes, and meteor impacts) usually behave gradually but are punctuated by catastrophic events. Examples of geoscience processes include surface weathering and deposition by the movements of water, ice, and wind. Emphasis is on geoscience processes that shape local geographic features, where appropriate.] |
|---|
| MS-ESS2-3. | Analyzing and Interpreting DataAnalyzing data in 6–8 builds on K–5 experiences and progresses to extending quantitative analysis to investigations, distinguishing between correlation and causation, and basic statistical techniques of data and error analysis.Analyze and interpret data to provide evidence for phenomena.“>Analyze and interpret data PatternsPatterns in rates of change and other numerical relationships can provide information about natural systems.“>on the distribution ESS2.B: Plate Tectonics and Large-Scale System InteractionsMaps of ancient land and water patterns, based on investigations of rocks and fossils, make clear how Earth’s plates have moved great distances, collided, and spread apart.“>of fossils and rocks, continental shapes, and seafloor structures to provide evidence of the past plate motions. [Clarification Statement: Examples of data include similarities of rock and fossil types on different continents, the shapes of the continents (including continental shelves), and the locations of ocean structures (such as ridges, fracture zones, and trenches).] [Assessment Boundary: Paleomagnetic anomalies in oceanic and continental crust are not assessed.] |
|---|
DCI
Second grade
ESS1.C: The History of Planet Earth
ESS2.B: Plate Tectonics and Large-Scale System Interactions
ESS2.C: The Roles of Water in Earth’s Surface Processes
Fifth Grade
ESS2.A: Earth Materials and Systems
ESS2.C: The Roles of Water in Earth’s Surface Processes
Middle School
ESS2.A: Earth’s Materials and Systems
ESS2.B: PLate Tectonics and Large-Scale System Interactions
ESS2.C: The Roles of Water in Earth’s Surface Processes
Crosscutting Concepts
Patterns
Stability and Change
fifth grade
Scale, Proportion, and Quantity
Systems and System Models
middle school
Patterns
Scale Proportion and Quantity
A period of extreme glaciation where a positive feedback loop led to Earth being covered almost entirely by ice.
A process where one change triggers the next in a continuous cycle that encourages the initial change.
The amount of energy reflected by a surface. Light surfaces tend to have a high albedo because they reflect more energy. Dark surfaces tend to have a low albedo because they absorb more energy.
A vent that allows magma, rock fragments, ash, and gases to escape to the surface of a planet or moon.
Theory that Earth's crust is divided into many pieces, called tectonic plates, which move over time due to convection currents in the mantle.
A supercontinent made of all of Earth's landmass that existed 200-250 million years ago.
Theory that states that all of Earth's land was originally a united supercontinent that drifted apart over time. This theory was eventually replaced by the theory of plate tectonics.
