Section 12: Making Decisions
Describe the role of statistics, data analytics, data science and managerialism in contemporary decision-making.
When you and your coworkers are trying to decide where you want to go for lunch, you need only to narrow the selection of restaurants, consider the ones in your price range, choose one and go. When it comes to making more complex decisions, there are plenty of external factors that can help (or hinder) your efforts.
Good businesses don’t “go with their gut.” They use all the statistics and data available to them when they make the decisions that will define their success as a company. We’re going to discuss statistics, data analytics, data science, and managerialism, and how they impact decision making.
Learning Outcomes
- Identify the steps to effectively use data in decision making
- Discuss big data and its implications on decision making
- Discuss the consequences of managerialism in decision making
- Discuss decision making tools
Using Data to Make a Decision
Now that we’ve discussed how an individual or a group can arrive at a good decision, let’s talk about some of the things they need to consider when they’re making that decision. And by “some of the things,” we mean data.
 Years ago, companies struggled and toiled over reports that would provide data on which to base a decision. Now, in this computerized universe, data is everywhere. It’s just a matter of harnessing it for your organization, reading it correctly, and making it work for you. Companies that use data in their decision making processes are more flexible and agile and stay competitive.
So how does an organization use data in its decision making processes? Well, let’s say that data just became available for the first time to your organization yesterday. These steps might be a good way to for you to approach the use of data in your decision making:
- Decide on your strategy
- Identify key areas and target data
- Collect the data
- Analyze the data
- Make a decision about the data
- Present your findings
Now, let’s dive a bit deeper into each of these steps!
Step 1: Decide on Your Strategy
It’s easy to get overwhelmed with all the data that’s out there to use, so when you’re incorporating data into your decision, it’s best to start with the strategy. What is it that you want to accomplish on behalf of the organization? What business areas do you want to improve? Get your action plan in place. If your goal is to increase the response speed to customers calling into your company’s service line, then you know where to start looking for information.
Step 2: Identify Key Areas and Target Data
Which questions do you want to answer about your customers calling into your company’s service line? You might want to know how many customers call in on average each day, but it might also be valuable to know which days are the busiest and which are the slowest. You may want to know how many customer service representatives are scheduled at any one given time and how long each of them spends on a call or email.
Step 3: Collect the Data
 Where is your data coming from? Is it from internal sources, or are you looking to purchase external data? It’s likely you’ll need to contact data owners and harvesters and put in your request. If you want to see all data on product sales for the last quarter, you will probably have to contact the people in finance to handle that. If you want to understand your organization’s turnover, someone in HRIS might be your best bet.
In many cases, departments will set up reports to run with a certain set of criteria. An HR department’s turnover reports might include salary level, title and job classification. If you want to see length of employment or department added to their regular reporting, this will likely take a little extra time and a few extra work hours to accomplish. Allow for that extra time when you’re planning your own work schedule.
Data can also be purchased. You may look to a company that collects and sells their customers’ personal information, like their addresses, income range, age, and buying habits. These lists are valuable for companies that want to employ direct mail to sell their product. Another kind of data that is often purchased by organizations is industry data. For instance, the American Pet Product Association (APPA) produces a “bible” of information for veterinarians, pet retailers and pet service providers. For a few thousand dollars, the APPA will share their research on the growth of the pet industry, how many US households own pets, what kind of pets they own, what kind of income they have, how many kids they have, and so on.
Whatever data you’re collecting, keep your strategy in mind as you request it. Will the data help you make educated decisions around your strategy? If not, don’t ask for it, because that would be a waste of your time and everyone else’s.
Step 4: Analyze the Data
You’ve come this far, now it’s time to look at the data that’s been provided and determine trends and information that can help your strategy. It could be that you have just a small slice of data, a page or two of numbers that isn’t hard to sift through. Or, you could have a terabyte hard drive full of stats and figures that would be almost impossible to go through by hand. No worries—there are computerized platforms that will help you get through this part. We’ll cover those a bit later.
You may also have to “clean” the data up as you analyze it. Are there items showing up in the reporting that you know shouldn’t factor in to your final decision? Maybe you’re looking at a turnover report, and it includes all people who were fired in their first 90 days on the job. You may have to back that data out of the report to get a true idea of how many employees (who aren’t in their probationary period) are choosing to leave the company.
As you come to conclusions about the data, make sure they’re accurate and insightful, that there aren’t any bogus “correlations” included in your interpretations.
Step 5: Make a Decision about the Data
 Be cognizant of the biases and other things that can trip you up as you make your decisions about the data, but determine the next steps for your strategy based on the information in front of you. Remember, the numbers never lie—but you can also make them say pretty much whatever you want. Don’t fall victim to confirmation bias when you’re lining up the data.
Step 6: Present Your Findings
Someone, somewhere, is interested in what you’re doing. Organizationally speaking, there are people who have hitched their wagons to your strategy’s star, and they’re waiting on your analysis to take action. Show them what you think the data is telling you, how you came to that decision, and how it will affect your decisions on your strategy moving forward. Agree, together or on your own, that you’re going to turn this data-based conclusion into action.
Practice Question
Those are the steps to using data to support decision making. Now let’s take a look at “big data” and how a person can get . . . well, a little overwhelmed with the amount of data that’s available to today’s decision-maker.
Big Data in Decision Making
Once upon a time, there was a small retailer with big ideas. After about five years, the retailer had approximately twenty locations, and the company decided they wanted to be even larger. This retailer sold a lot of franchise locations, opened a lot of corporate locations, and suddenly found itself with over 400 stores in over thirty states. But they were still operating like a mom-and-pop business: sales were being tallied on spreadsheets and product pricing was like throwing a dart at a bunch of numbers on a wall. Orders in their distribution center were being printed off, and people with carts would wheel around, picking items off a shelf and boxing them up by hand.
A retailer that was growing couldn’t continue to operate that way, so they went out and bought a whole new retail management system that changed everything. From the way merchandise was “picked” in the distribution center to how the customer was handled at the cash register, everything was computerized. Loyalty programs were developed for repeat customers, emails were collected—and all of that data was being collected on the back end, ready to be spit out in a variety of cookie-cutter reports, or even customized ones. Sales information was being collected at the speed of a transaction every couple of seconds, and that was just the start.
When the leadership team went to look at the data they were collecting, when they were ready to make some decisions and wanted some data to help get to the right answers, there was so much data to look at, they didn’t even know where to begin. Where once they had to guess what kind of customer was buying Item A, now they knew her email, her income level, the time of day she normally shopped, how many times a year she bought that item and what other items she chose to buy when she bought that item.
It was enough to make their heads explode.

The term “big data” is used to describe extremely large data sets that may be analyzed computationally to reveal patterns, trends, and associations, especially relating to human behavior and interactions. Often, this data is too large or complex for traditional data-processing application software.
Data can have many rows, or cases of information, but not be terribly complex. Think in terms of the sales of Item A above. We might be able to look at information about the size of the product (did they buy the 10 oz or 22 oz package?), the location at which the sale took place, and the time of day it sold. There might be 700 instances of the sale of that item, so there are 700 rows, or cases, of data.
Now let’s take the information on the customer. We know her age, her income range, and the time of day that she wants to shop. We know the types of products she buys in the store, and what kind of coupons get her to make an extra trip in to shop. We know that she shops primarily at the store on Main Street, but that she sometimes stops in to the store on Pine Street. This is data that has more attributes or columns, and features a higher complexity.
Data with many cases of information is considered to be statistically powerful. Data with more attributes and a higher complexity is more likely to lead to a false discovery rate.
Practice Question
Challenges with big data include the ability to capture it to begin with, storing such large amounts of data when it’s captured, analyzing it, sharing it, and even keeping the information secure and private.
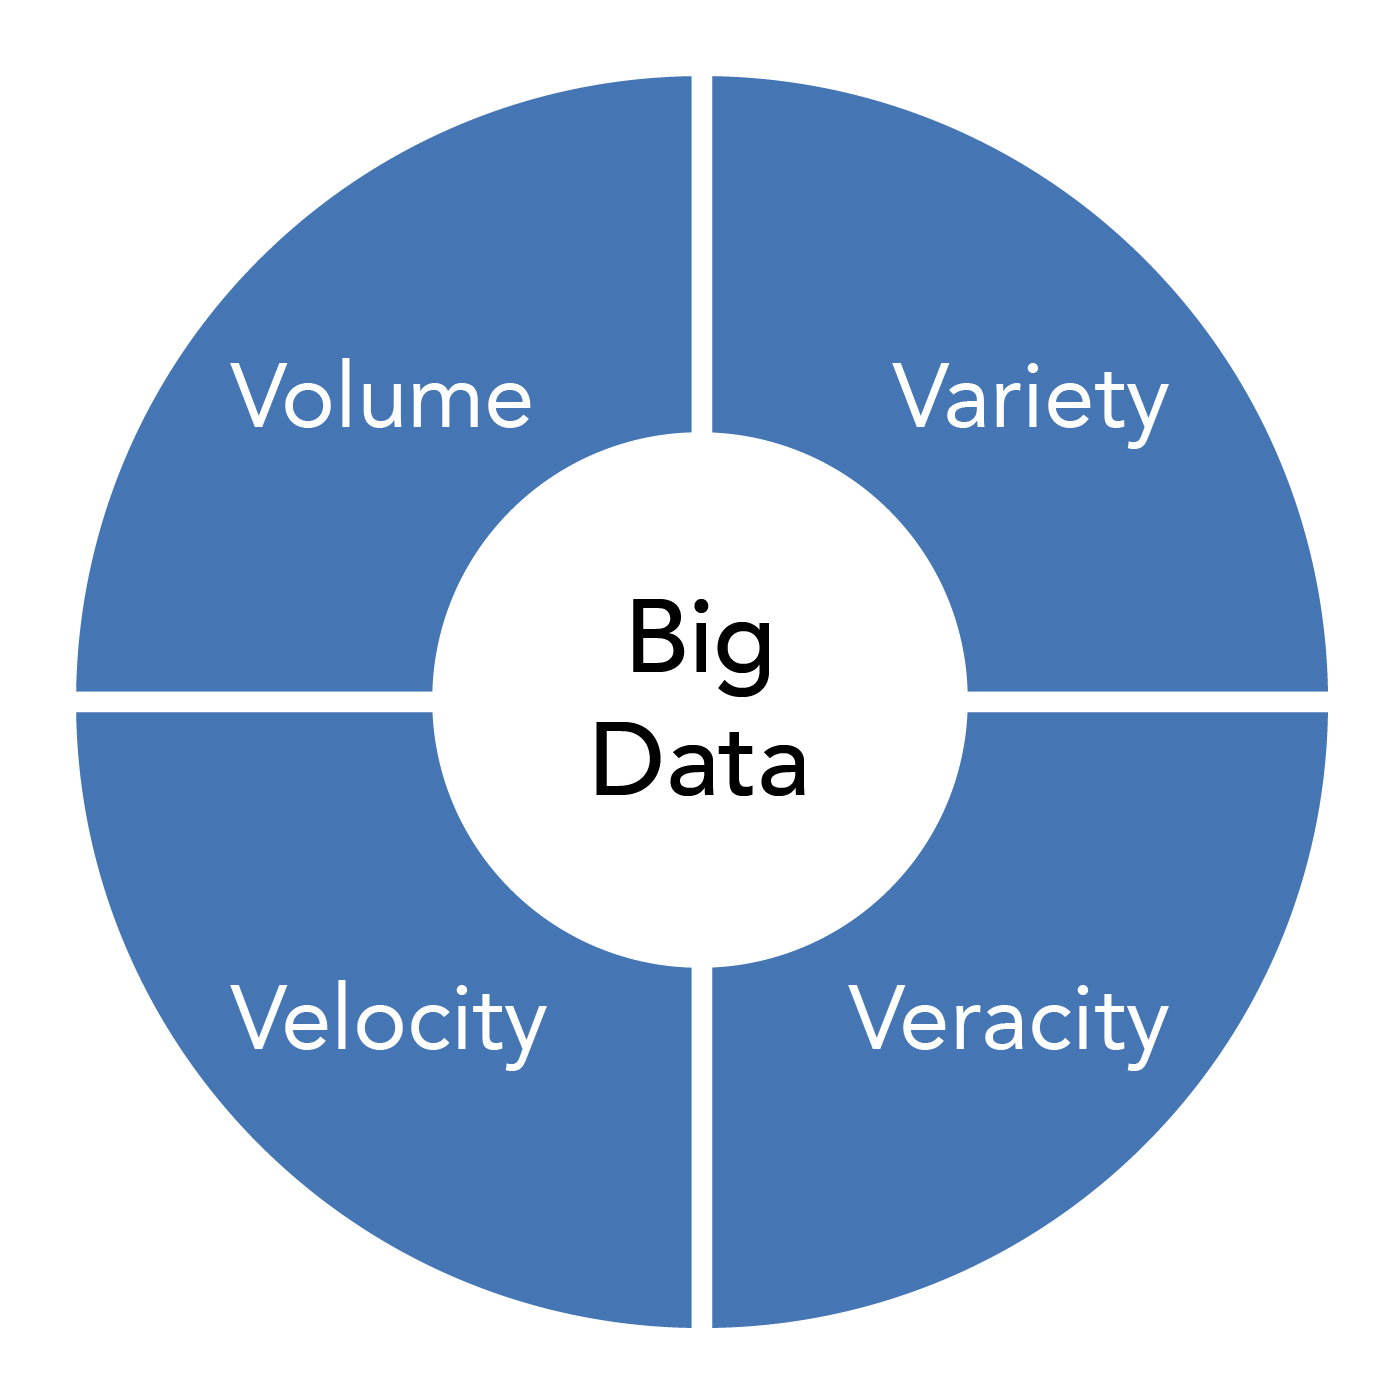 IBM data scientists broke the concept of big data into four pieces: volume, velocity, variety, and veracity.
- Volume. This refers to the amount of data being collected—and it’s always huge. Just think of this: 90% of all the data in the world was generated in the last two years. Volume is the amount of data being generated and collected—the size of the sample will determine if it’s big data or not. Putting things in perspective, the retail chain Walmart has more than 2.5 petabytes of customer data just from the 1 million+ transactions they handle every hour. That’s 167 times the amount of information held in all the Library of Congress.
- Velocity. This is the speed at which data is generated and made available. A lot of data is available in real time. Two kinds of velocity as they relate to big data are frequency of generation and frequency of handling, recording and publishing.
- Variety. There are two types of data: structured and unstructured. Structured data is the kind you think of when you think “data”—like the date, amount, and time columns on a bank statement. Unstructured data is all of the other data that’s out there—tweets on twitter, your mobile phone’s voice mails, photos, GPS locators. One of the goals of big data has been to take those unstructured types of data and learn how to make sense of them.
- Veracity. This term refers to how accurate the data is. There is inherent discrepancy in all data collected, and a good data analyst will account for those discrepancies or clean up the data. Still, overall, the inaccuracy of data costs companies billions of dollars each year.
Big data was an issue when companies didn’t know how to handle the sheer amount of data being collected and how quickly the information was coming in. Now, there are consultants to help organizations handle and process the data (it’s a $100 billion industry), and companies have learned to adjust and prepare in other ways. Big data can help an organization make very accurate decisions that create a huge impact.
Kroger
The grocery retailer Kroger sent out a magazine with recipes and other food related articles. Each article was about a food their consumer was likely to use, and the insert featured coupons for brands the consumer used. Big data helped Kroger increase customer engagement by informing their customer rewards through accurate couponing. Kroger analyzes the data of 770 million transactions and boasts that 95% of their transactions come with loyalty card use, which ultimately equates to $12 billion in incremental revenue.
Red Roof Inn
The Red Roof Inn looked to big data to help them capitalize on stranded travelers. In the coldest depths of winter, when recreational travel is at its low point of the year in cold weather areas, Red Roof Inn was able to examine historical weather information, historical flight information, and ultimately start targeting marketing efforts to the 90,000 passengers that end up stranded due to winter weather. Big data helped Red Roof determine the areas where their services might come in handy, and pointed them to mobile advertising and other methods to drive digital bookings.
Taming big data definitely has its rewards.
Managerialism in Decision Making
In order to understand managerialism and decision making, one must first have a grasp of what managerialism is—and that’s not necessarily the easiest definition to understand.
 The definition of managerialism is the belief in or reliance on the use of professional managers in administering or planning an activity. It’s ideological, an approach that sees businesses and organizations as the core building blocks of society, rather than citizens and their needs and wishes. And, similar to other ideologies, like communism and socialism, there are aspects of managerialism that look great on paper, are well thought out, and just don’t succeed in the real world.
As you can imagine, researchers over the years have had their fair share of things to say about managerialism. Henri Fayol and Frederick Winslow Taylor’s early concepts of management were seen differently as managerialism came about, expressed in the simple formula:
Management + Ideology + Expansion = Managerialism
The “expansion” part of that equation suggests that managerialism is an appropriate way to run any kind of organization. For example, MBAs are a more appropriate choice to run a hospital than doctors and nurses. Or maybe those experienced, professional managers, so skilled at business decisions, are the best choice to run a university or even a public school system.
In his book Managerialism: The Emergence of a New Ideology, Willard Enteman stated that capitalism had already ended, that industrial nations were not democratic, and that “managerialism” more accurately describes the world as it is today.1 Robert Locke and J.C. Spender, management experts, saw managerialism as an expression of management entrenching itself ruthlessly and systemically in an organization.2 Australian scholar Thomas Klikauer took that a step further when he said:3
Managerialism combines management knowledge and ideology to establish itself systemically in organisations and society while depriving owners, employees (organisational-economical) and civil society (social-political) of all decision-making powers. Managerialism justifies the application of managerial techniques to all areas of society on the grounds of superior ideology, expert training, and the exclusive possession of managerial knowledge necessary to efficiently run corporations and societies.
Now, if you feel like you know less about managerialism than when you started, don’t feel alone. It’s not a well-defined concept and, as Klikauer recognized, it’s not deeply studied. So we’re going to stop here and take away these two things:
- Most people feel that managerialism is pejorative.
- Managerialism deprives individuals with expertise of all decision making powers.
If we understand that basic opinion about managerialism, we’ll be able to talk about how it can impact decision making.
So let’s take that hospital situation as an example. Now, studies have shown that hospitals that are lead by managers who are not medically trained do as well, from a profit standpoint, as hospitals that are doctor led. That said, those that are making decisions—and those that are putting them into action—are often at odds.
In 2017, the German medical journal Deutches Artzeblatt published a study on the commercialization of patient-related decision making. Researchers Weihkamp and Neagler set out to determine if doctors and management at hospitals shared the sentiment that admittance, treatment, and discharge of patients was being affected by economic factors, like ensuring that the hospital made a profit.4
They carried out research in the form of interviews and focus groups between 2013 and 2016, and then published these results:[1]
Some of the doctors’ and CEOs’ perceptions of the patient-care situation differed markedly from each other. The CEOs mentioned the need for a profit orientation and stressed that they obeyed the legal requirement not to have any direct influence on medical decision-making, while acknowledging that physicians’ actions might be influenced indirectly. The doctors, on the other hand, reported feeling increasing pressure to consider the economic interests of the hospital when making decisions about patient care, leading not only to overtreatment, undertreatment, and incorrect treatment, but also to ethical conflicts, stressful situations, and personal frustration.
Is managerialism having an effect here, because it’s taking decision making out of the hands of those who carry out the mission at a hospital and putting it into the hands of a manager who is working to make sure the hospital makes a profit? The report went on to say5:
The doctors’ responses indicate that the current economic framework conditions and the managers of hospitals are currently influencing medical care to the detriment of the patients, physicians, and nurses. It is important to acknowledge that economic pressure on hospitals can undermine the independence of medical decision making. The dilemmas facing doctors and hospital CEOs should be openly discussed.
Can this happen as suggested? Managerialism, by the definition provided to us by Locke, Spender, and Klikauer, would suggest to us that ownership of decision making is not shared. Decision making is entirely owned by managers. Should that situation not change in these hospitals where these studies took place, then patients will continue to suffer the consequences. Such is the impact of managerialism on decision making.
Practice Question
Managerialism is being redefined and reimagined, with neo-liberal approaches and “new managerialism” approaches that suggest, to some degree, a better decision-making process (that even includes the participation of consumers). Certainly, the pejorative version of managerialism defined for us by those scholars cannot continue to provide services and products at the level consumers expect, so this concept is likely to change and grow as we continue to explore the most successful ways decisions are made.
Decision Making Tools
One thing almost everyone has in common is that we all want to make good decisions. That’s been the motivation of many a decision-making tool. Over time, people have created and refined tools for every type of decision.
Almost all charts, diagrams and reports lend themselves to decision making in one way or another. But here in this section, we’re going to take a look at some of the tools that are most specifically devoted to the decision-making process.
Pareto Diagram
What it does for you: It identifies beneficial opportunities and issues.
A Pareto chart contains both bars and a line graph, where individual values are represented in descending order by bars, and the cumulative total is represented by the line. The chart below outlines titanium investment casting defects. The chart is meant to highlight the most important among a list of factors. The bar chart is the frequency of occurrence, and the line graph shows the cumulative percentage of time these issues occur. Looking at this bar chart, if we wanted to decrease titanium investment casting defects by 80%, we’d need to tackle the first two issues on the chart. The Pareto chart helps you define and tackle the issues that have the most impact on your problem.

Cause and Effect or Ishikawa Diagram
What It Does For You: Helps you hone in on the exact cause of an issue.
As you can see from the cause and effect diagram below (or fishbone diagram, because it looks very much like the bones of a fish), the user needs to list all the possible causes of a particular issue, by category. Each category is a “bone” of the fish. The issue is listed in the fish’s head. In this instance, the group is looking at why so much staff is required for a particular process. The answers are divided into categories, like “policies” and “procedures” below.

This is commonly used with product design and quality issues, and, as a very visual brainstorming tool, can spark many more ideas for cause/effect issues. On the other hand, bigger issues can start to look cluttered, and interrelationships between causes are hard to identify using this method.
Feasibility Reporting
What it does for you: It lets you know the rate of return on the investment of your project.
Now we’re doing math! (It was inevitable). Feasibility reporting, packed with things like cost-benefit analysis and payback calculations, allows an organization to see all the details of a particular project: when it will start paying back, what the rate of return is on the investment, and so on.
Benefit cost ratio and payback are just a portion of a feasibility report, but this short video shows you the kind of information you’re likely to see and thus, the kinds of decisions it can help you make.
SWOT Analysis
What it does for you: Helps with strategic planning and decision making.
SWOT stands for strengths, weaknesses, opportunities and threats. SWOT analysis helps you identify the internal strengths and weaknesses of your organization that give you an advantage over others of your kind, and reminds you to look for external opportunities and threats at the same time. It helps an organization identify its objectives and determine which environmental and non-environmental factors are favorable to that success.
This sample SWOT analysis shows the considerations of a particular organization as they went through their strategic planning process.
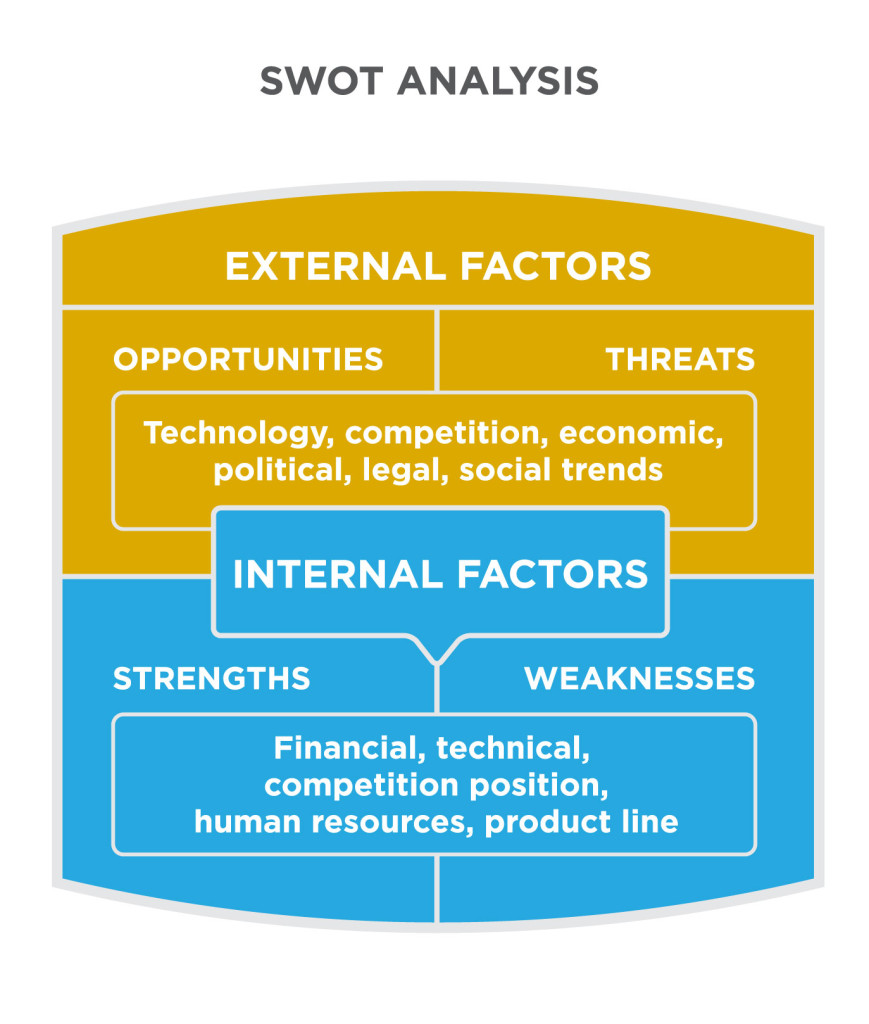
A SWOT analysis can be used any time a business or individual wants to determine if a particular objective is achievable. Limitations of the SWOT analysis have also been noted, chief among them that the list weighs heavily on perception rather than actual assessment of strengths and weaknesses.
Decision Making Diagrams
What they do for you: They help you see all the alternatives and the associated costs.

The decision-making diagram allows you to map out all the possible alternatives to each decision, their costs and even chances of success or failure. In the diagram above, an individual is trying to decide between Vendor 1 and Vendor 2. As you can see in the diagram, Vendor 2’s probability of failure is only 20%, at a cost of $2,400, but would have an impact of $12,000 total, compared with Vendor 1’s $10,000 total impact in the case of failure. Looks like Vendor 1 is a bigger risk with a bigger payoff. Which would you choose?
Decision-Making Software
What it does for you: Allows for collaborative decision making and parsing large amounts of data.
There are a variety of decision making software solutions on the market today to help in any situation you might find yourself in. These software solutions allow for collaborative decision making, analysis, and reporting of substantial amounts of data.
Vroom-Yetton-Jago Decision Making Model6
What it does for you: Helps you figure out the best method to make a decision and who to involve.
Vroom, Yetton, and Jago created a decision model to help you decide how you were going to make a decision. Should you make a decision individually or assemble the group and make a decision together? These are the questions you should ask yourself, according to Victor Vroom and his compatriots:
- Is the quality of the decision important?
- Is team commitment important for the decision?
- Do you have enough information to make the decision on your own?
- Is the problem well-structured?
- Would the team support you if you made the decision alone?
- Does the team share the organizational goals?
- Is conflict among the team over the decision likely?

Note the significance of the annotations on the chart:
- Autocratic (A1): The leader makes the decision by himself using existing information without any communication with the team.
- Autocratic (A2): The leader consults with team members to get information, but makes the decision by himself or herself without informing the group.
- Consultative (C1): The leader consults the team members to get their opinion about the situation, but he or she makes the decision for themselves.
- Consultative (C2): The leader consults the team members seeking opinions and suggestions, but he or she makes the decision for himself or herself. In this type of leadership style, the leader is open to suggestions and ideas.
- Collaborative (G): The leader shares the decision making process with team members. He or she supports the team in making the decision and finding an answer that everyone agrees on.
The model doesn’t allow for the personality characteristics of the leader, allow for large group use, or provide questions that are precise enough. That said, it’s very flexible and allows the leader the ability to make a good decision in a variety of different situations. It can also be shared and duplicated.
Practice Question
There are many more tools out there, ranging from complex software to back-of-the-napkin “T charts” that help an individual weigh the pros and cons of any given situation. The idea here is to understand that you don’t have to go into the decision-making process alone and confused – there are tools and processes that can help you make decisions the right way!
1. Enteman, Willard F. Managerialism: The Emergence of a New Ideology. Madison, WI: University of Wisconsin Press, 1993.
2. Locke, Robert R., and J.-C Spender. Confronting Managerialism: How the Business Elite and Their Schools Threw Our Lives out of Balance. London: Zed Books, 2011.
3. Klikauer, Thomas. Managerialism a Critique of an Ideology. Basingstoke: Palgrave Macmillan, 2013.
4. Wehkamp, Karl-Heinz, and Heinz Naegler. “The Commercialization of Patient-Related Decision Making in Hospitals.” Deutsches Aerzteblatt Online, November 24, 2017. doi:10.3238/arztebl.2017.0797.
5. Ibid
6. Wehkamp, Karl-Heinz, and Heinz Naegler. “The Commercialization of Patient-Related Decision Making in Hospitals.” Deutsches Aerzteblatt Online, November 24, 2017. doi:10.3238/arztebl.2017.0797.
- Data and Managerialism in Decision Making. Authored by: Freedom Learning Group. Provided by: Lumen Learning. License: CC BY: Attribution
- Image: Big Data. Provided by: Lumen Learning. License: CC BY: Attribution
- Image: Decision Making Diagrams. Provided by: Lumen Learning. License: CC BY: Attribution
- Image: Vroom-Yetton-Jago Model. Provided by: Lumen Learning. License: CC BY: Attribution
- Pareto chart. Authored by: Daniel Penfield. Provided by: Wikimedia Commons. Located at: https://commons.wikimedia.org/wiki/File:Pareto_chart_of_titanium_investment_casting_defects.svg. License: CC BY-SA: Attribution-ShareAlike
- Cause and effect diagram. Authored by: Daniel Penfield. Provided by: Wikimedia Commons. Located at: https://commons.wikimedia.org/wiki/File:Cause_and_effect_diagram_for_defect_XXX.svg. License: CC BY-SA: Attribution-ShareAlike
- SWOT Analysis. Provided by: Lumen Learning. Located at: https://courses.lumenlearning.com/wmopen-introductiontobusiness/chapter/introduction-to-planning/. License: CC BY: Attribution
- Data Studio. Authored by: Stephen Dawson. Provided by: Unsplash. Located at: https://unsplash.com/photos/qwtCeJ5cLYs. License: CC0: No Rights Reserved. License Terms: Unsplash License
- Paper Files. Authored by: Ag Ku. Provided by: Pixabay. Located at: https://pixabay.com/photos/files-paper-office-paperwork-stack-1614223/. License: CC0: No Rights Reserved. License Terms: Pixabay License
- Digital Marketing Technology. Authored by: Photo Mix. Provided by: Pixabay. Located at: https://pixabay.com/photos/digital-marketing-technology-1433427/. License: CC0: No Rights Reserved. License Terms: Pixabay License
- Untitled. Authored by: Gerd Altmann. Provided by: Pixabay. Located at: https://pixabay.com/illustrations/web-network-programming-3706562/. License: CC0: No Rights Reserved. License Terms: PIxabay License
- Owner. Authored by: Hunters Race. Provided by: Unsplash. Located at: https://unsplash.com/photos/MYbhN8KaaEc. License: CC0: No Rights Reserved. License Terms: Unsplash License
- Benefit Cost Ratio and Payback. Authored by: Conservation Strategy Fund. Located at: https://youtu.be/X5yaXdTwfLE. License: All Rights Reserved. License Terms: Standard YouTube License
- Ibid. ↵
